08. Color Region

Color and Region Selection

Question:

In this next quiz, I've given you the values of red_threshold , green_threshold , and blue_threshold but now you need to modify left_bottom , right_bottom , and apex 
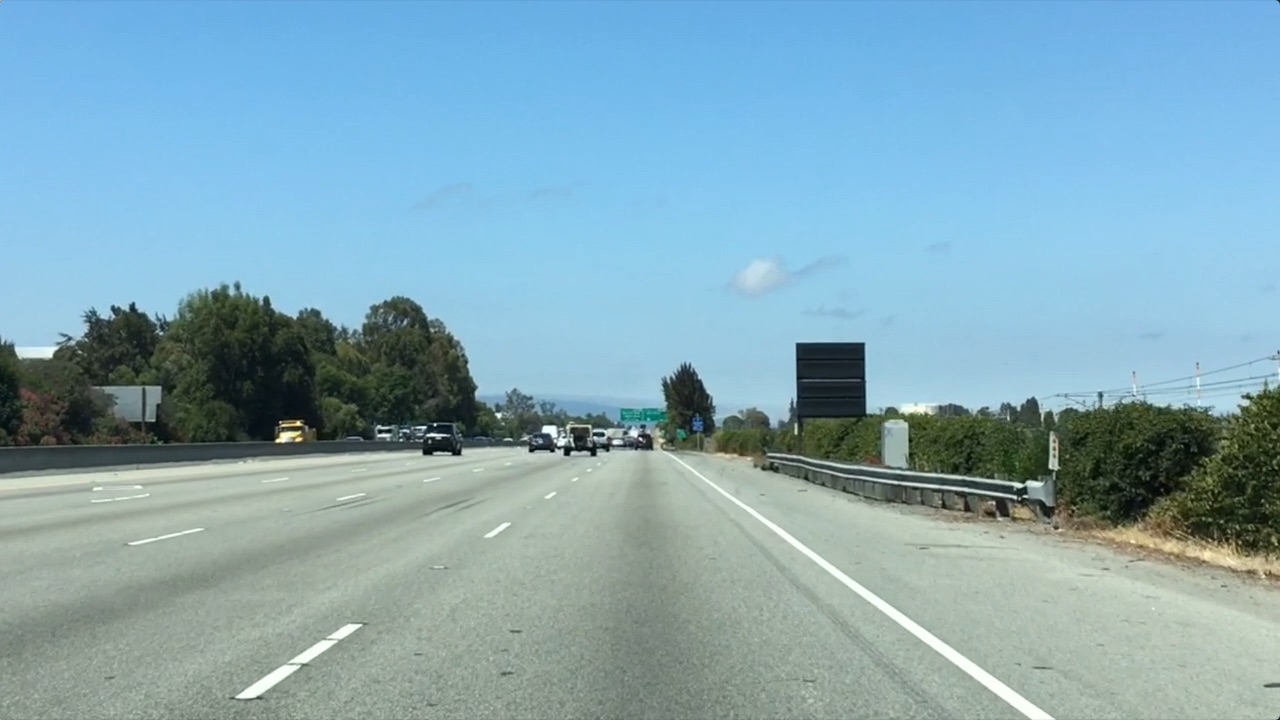
to represent the vertices of a triangle identifying the region of interest in the image. When you run the code in the quiz, your output result will be several images. Tweak the vertices until your output looks like the examples shown below.

The original image (left), region and color selection applied (center) and lines identified (right).

Start Quiz:

import matplotlib.pyplot as plt
import matplotlib.image as mpimg
import numpy as np

# Read in the image
image = mpimg.imread('test.jpg')

# Grab the x and y size and make a copy of the image
ysize = image.shape[0]
xsize = image.shape[1]
color_select = np.copy(image)
line_image = np.copy(image)

# Define color selection criteria
# MODIFY THESE VARIABLES TO MAKE YOUR COLOR SELECTION
red_threshold = 200
green_threshold = 200
blue_threshold = 200

rgb_threshold = [red_threshold, green_threshold, blue_threshold]

# Define the vertices of a triangular mask.
# Keep in mind the origin (x=0, y=0) is in the upper left
# MODIFY THESE VALUES TO ISOLATE THE REGION 
# WHERE THE LANE LINES ARE IN THE IMAGE
left_bottom = [0, 539]
right_bottom = [900, 300]
apex = [400, 0]

# Perform a linear fit (y=Ax+B) to each of the three sides of the triangle
# np.polyfit returns the coefficients [A, B] of the fit
fit_left = np.polyfit((left_bottom[0], apex[0]), (left_bottom[1], apex[1]), 1)
fit_right = np.polyfit((right_bottom[0], apex[0]), (right_bottom[1], apex[1]), 1)
fit_bottom = np.polyfit((left_bottom[0], right_bottom[0]), (left_bottom[1], right_bottom[1]), 1)

# Mask pixels below the threshold
color_thresholds = (image[:,:,0] < rgb_threshold[0]) | \
                    (image[:,:,1] < rgb_threshold[1]) | \
                    (image[:,:,2] < rgb_threshold[2])

# Find the region inside the lines
XX, YY = np.meshgrid(np.arange(0, xsize), np.arange(0, ysize))
region_thresholds = (YY > (XX*fit_left[0] + fit_left[1])) & \
                    (YY > (XX*fit_right[0] + fit_right[1])) & \
                    (YY < (XX*fit_bottom[0] + fit_bottom[1]))
                    
# Mask color and region selection
color_select[color_thresholds | ~region_thresholds] = [0, 0, 0]
# Color pixels red where both color and region selections met
line_image[~color_thresholds & region_thresholds] = [255, 0, 0]

# Display the image and show region and color selections
plt.imshow(image)
x = [left_bottom[0], right_bottom[0], apex[0], left_bottom[0]]
y = [left_bottom[1], right_bottom[1], apex[1], left_bottom[1]]
plt.plot(x, y, 'b--', lw=4)
plt.imshow(color_select)
plt.imshow(line_image)
Solution:

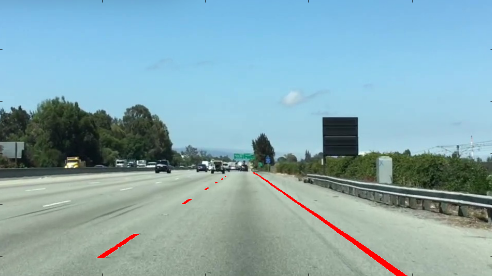
Here’s how I did it: After selecting red_threshold = green_threshold = blue_threshold = 200 , I chose the vertices of my triangle to be left_bottom = [0, 539] , right_bottom [900, 539] , and apex = [475, 320] , which produces the result shown below.

The original image (left), region and color selection applied (center) and lines identified (right).